
Introduction
Imagine you get a surprise raise at work. It’s not huge, but it’s noticeable. What do you do next? Do you spend most of it on groceries, rent, or a small treat for yourself—or do you stash it away in savings and barely change your lifestyle? That simple, everyday decision sits at the heart of one of the most important ideas in economics: the marginal propensity to consume.
The marginal propensity to consume (often shortened to MPC) explains how people react to changes in income. It helps economists predict consumer behavior, governments design stimulus packages, and businesses forecast demand. More importantly, it explains real human behavior—why some people spend quickly when their income rises, while others save most of it.
In this guide, we’ll break down the marginal propensity to consume in clear, practical terms. You’ll learn what it really means, how it works in everyday life, why it matters for the economy, and how it’s actually calculated and used. Whether you’re a student, a finance professional, a policymaker, or simply someone curious about how money flows through society, this article will give you a deep, usable understanding you can apply immediately.
Understanding the Marginal Propensity to Consume in Plain English
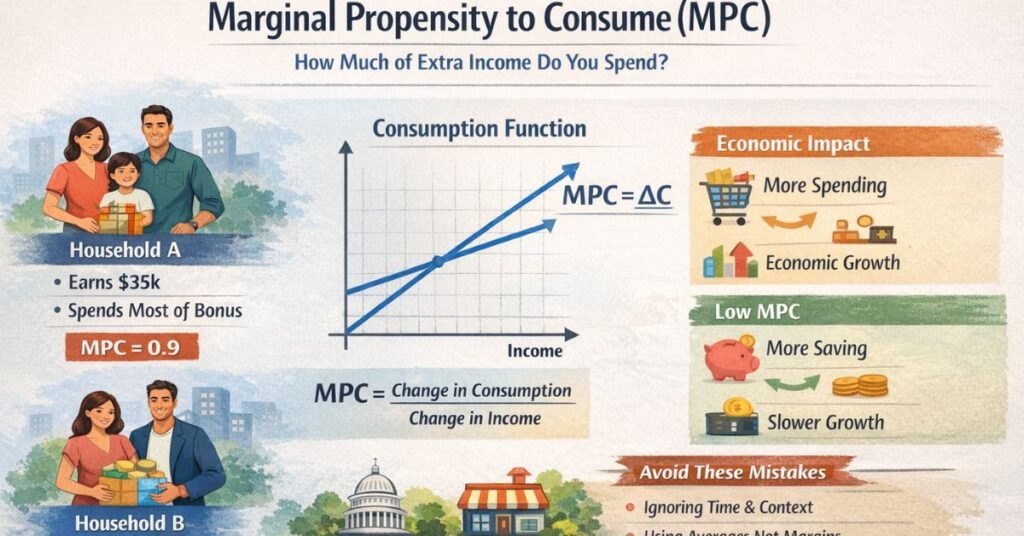
At its core, the marginal propensity to consume measures how much of an extra dollar of income a person spends rather than saves. If you earn an extra $100 and spend $80 of it, your marginal propensity to consume is 0.8. The remaining $20 goes into savings, which relates to a companion concept known as the marginal propensity to save.
Think of MPC like a behavioral thermometer. It doesn’t measure total spending, but the change in spending when income changes. That distinction matters. Someone earning $30,000 a year and spending $25,000 may have a different MPC than someone earning $300,000 and spending $250,000, even though both spend a lot in absolute terms.
A helpful analogy is pouring water into two sponges. One sponge is dry and absorbs almost all the water immediately. The other is already damp and absorbs very little. Lower-income households often act like the dry sponge—they spend most new income on essentials. Higher-income households tend to act like the damp sponge, saving a larger share of additional income.
Economists typically say MPC falls between 0 and 1. A value close to 1 means most extra income is spent. A value closer to 0 means most of it is saved. This simple ratio drives massive economic outcomes, from recessions to recoveries.
Why the Marginal Propensity to Consume Matters So Much
The marginal propensity to consume isn’t just an academic concept. It plays a central role in how economies grow, stagnate, or recover from shocks. When MPC is high across an economy, money circulates quickly. When it’s low, money tends to sit idle in savings accounts and investments.
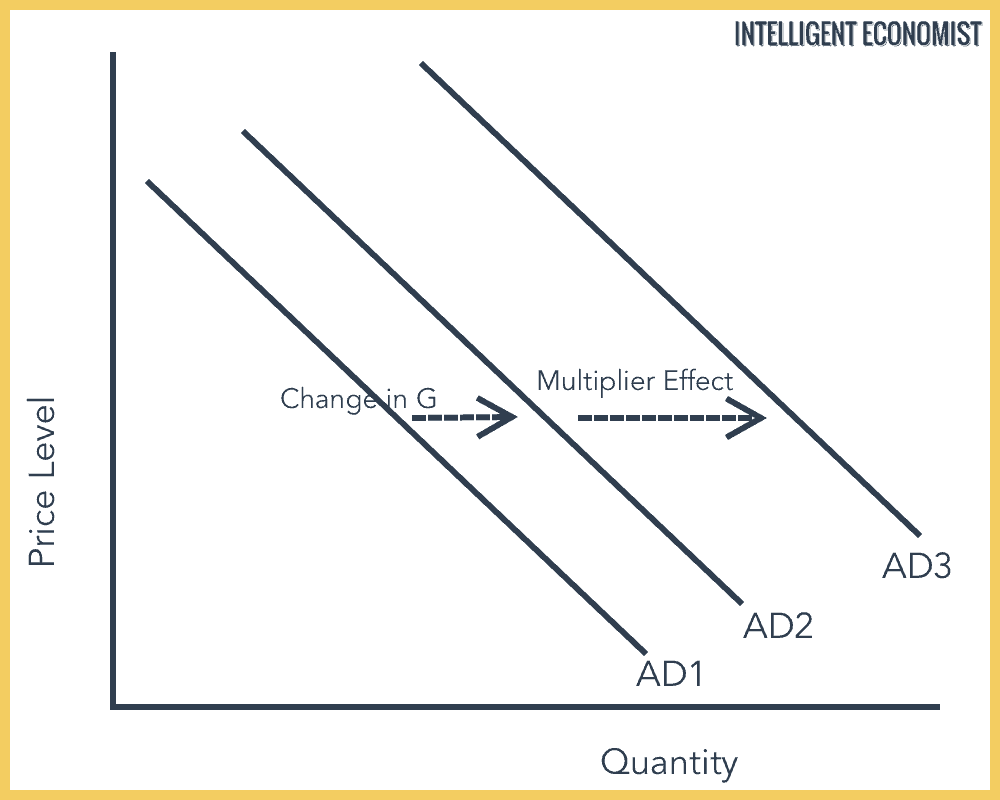
One of the biggest reasons MPC matters is its connection to the spending multiplier. When someone spends extra income, that spending becomes someone else’s income. If they also spend most of it, the effect compounds. A high MPC means a stronger multiplier and a larger impact from any increase in income.
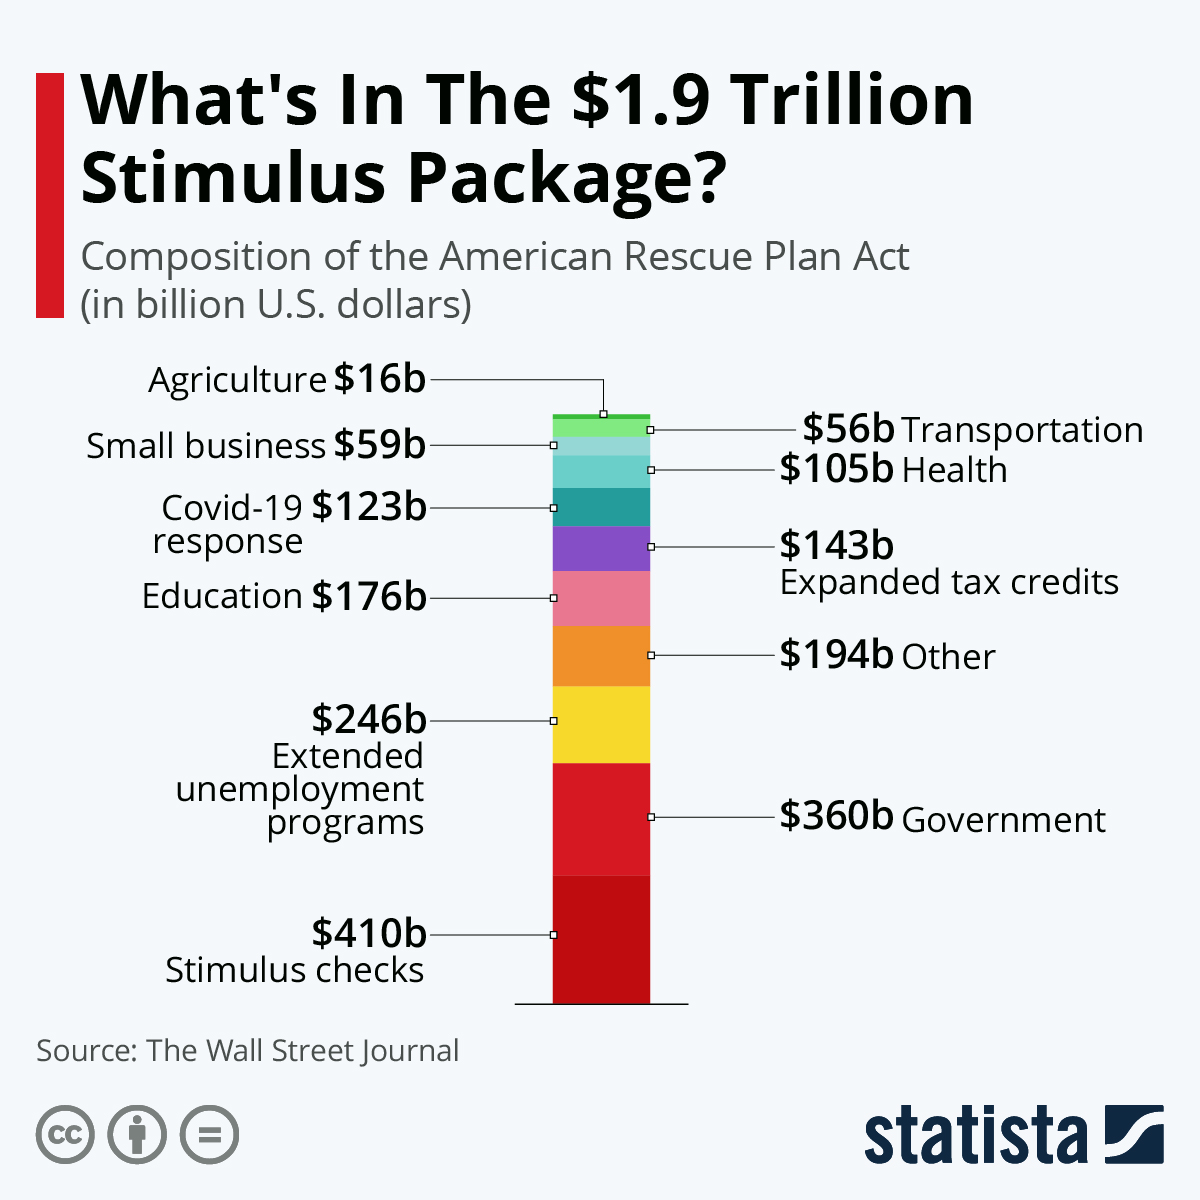
This is why governments care deeply about MPC when designing stimulus policies. Direct payments to households with high MPCs often generate more immediate economic activity than tax cuts for high earners who may save most of the money. Businesses also use MPC insights to forecast demand. If wages rise in a sector with high MPC workers, companies can expect increased sales.
On a personal level, understanding MPC helps explain why financial advice differs across income levels. For someone living paycheck to paycheck, spending increases are often unavoidable. For someone with financial flexibility, saving becomes a more realistic option. MPC reflects those lived realities.
Real-World Examples of Marginal Propensity to Consume
Let’s bring this concept to life with a few concrete scenarios. Imagine two households receive the same $1,000 bonus.
Household A earns $35,000 a year. Rent, food, utilities, and transport already consume most of their income. When the bonus arrives, they immediately spend $900 on overdue bills, groceries, and a minor car repair. Their marginal propensity to consume is 0.9.
Household B earns $150,000 a year. Their essentials are already covered comfortably. They spend $300 on a weekend getaway and put $700 into savings or investments. Their marginal propensity to consume is 0.3.
Neither household is behaving irrationally. Their decisions reflect constraints, priorities, and security. Multiply this behavior across millions of households, and you begin to see how MPC shapes entire economies.
Another example shows up during recessions. When people feel uncertain about the future, even those with historically high MPCs may reduce spending. Fear lowers MPC temporarily, slowing recovery. This is why confidence and expectations matter just as much as income itself.
Who Benefits Most from Understanding MPC
Understanding the marginal propensity to consume isn’t limited to economists. It offers practical benefits to several groups.
Students and educators use MPC to understand macroeconomic models and policy outcomes. It’s a foundational concept that unlocks more advanced ideas like fiscal multipliers and aggregate demand.
Business owners and marketers benefit by predicting customer behavior. If your target audience has a high MPC, promotions tied to income boosts—bonuses, refunds, seasonal work—can be extremely effective.
Policy makers rely on MPC to design effective economic interventions. Knowing where money will be spent rather than saved helps maximize impact.
Individuals can also gain insight into their own financial habits. Recognizing whether you tend to spend or save additional income can help you plan budgets, set goals, and make more intentional decisions.
In short, MPC is a lens that reveals how money actually moves through real lives and real systems.
How to Calculate Marginal Propensity to Consume Step by Step
Calculating the marginal propensity to consume is straightforward, but using it correctly requires attention to context.
The basic formula is simple: MPC equals the change in consumption divided by the change in income. In plain terms, you look at how much spending increases when income increases.
Here’s a step-by-step breakdown. First, identify a change in income. This could be a raise, a bonus, a tax refund, or government support. Second, measure the change in consumption that follows. Focus only on new spending caused by the income increase. Third, divide the spending change by the income change.
For example, if income rises by $500 and spending rises by $400, MPC is 0.8. If income rises by $500 and spending rises by $100, MPC is 0.2.
Best practice is to look at short-term behavior. MPC is about immediate or near-term responses, not long-term lifestyle changes. It’s also important to isolate causation. If spending rose for unrelated reasons, the calculation becomes misleading.
Economists often calculate MPC across groups or entire economies using surveys and national accounts. Individuals can calculate their personal MPC by tracking income changes and spending over time.
Tools and Methods Used to Measure MPC in Practice
Measuring the marginal propensity to consume at scale requires data, tools, and judgment. Governments and researchers often rely on household expenditure surveys, tax data, and banking records to estimate consumption responses.
Spreadsheets are a common starting point for individuals and small businesses. Tracking income changes and corresponding expenses over time can reveal patterns. Budgeting apps can also provide useful data, especially if they categorize spending automatically.
At a more advanced level, economists use statistical software to analyze large datasets. These tools allow them to control for variables like inflation, demographics, and economic conditions. While paid platforms offer powerful capabilities, free tools can still provide meaningful insights when used carefully.
The key is consistency. Whether you’re using a simple notebook or advanced software, reliable MPC estimates depend on accurate, consistent data and a clear definition of what counts as consumption.
Common Mistakes People Make When Using MPC
One frequent mistake is confusing average consumption with marginal consumption. Spending a high percentage of income overall does not automatically mean a high marginal propensity to consume. MPC only looks at changes.
Another common error is ignoring time. People may save a bonus initially but spend it months later. Short-term MPC may appear low, even though long-term spending increases. Context matters.
People also forget emotional and psychological factors. Fear, optimism, and uncertainty all influence spending behavior. Treating MPC as a fixed number can lead to flawed conclusions.
Finally, applying average MPC values to individuals can be misleading. Group averages hide variation. A policy designed for a “typical” household may miss the mark for many real people.
Avoiding these mistakes means using MPC as a guide, not a rigid rule.
The Relationship Between MPC and Economic Growth
The marginal propensity to consume is tightly linked to economic growth. When MPC is high, increases in income lead to more spending, higher demand, and greater production. Businesses respond by hiring more workers and investing in expansion, which further increases income.
When MPC is low, income gains don’t translate into immediate demand. Growth slows, and economies may rely more heavily on investment or exports to compensate.
This relationship explains why inequality can affect growth. If income gains flow mainly to high earners with low MPCs, overall consumption may grow slowly. When income increases are distributed toward groups with higher MPCs, growth tends to be more robust.
Understanding this dynamic helps explain many modern policy debates, from minimum wage laws to tax policy and social support programs.
4
Marginal Propensity to Consume vs Marginal Propensity to Save
MPC always works alongside marginal propensity to save. Together, they add up to one. If you spend 70 percent of extra income, you save 30 percent. There is no escaping this relationship.
Understanding both concepts provides a fuller picture of financial behavior. Saving isn’t bad, and spending isn’t always good. Economies need both. Savings fund investment, while consumption drives demand.
Problems arise when the balance shifts too far in one direction. Excessive saving can lead to weak demand and slow growth. Excessive consumption without saving can lead to debt and instability. MPC helps economists and individuals find that balance.
Using MPC for Smarter Personal and Business Decisions
On a personal level, knowing your own marginal propensity to consume can be eye-opening. If you notice that every raise disappears into lifestyle upgrades, you may want to consciously redirect some income toward savings or investments.
Businesses can use MPC insights to plan pricing, promotions, and expansion. Understanding how customers react to income changes can guide product launches and marketing strategies.
For policy makers, MPC is a decision-making compass. It helps answer practical questions about where money will have the greatest impact.
Conclusion
The marginal propensity to consume may sound technical, but it describes something deeply human: how we respond when our financial situation changes. It explains why some money moves quickly through the economy while other money sits still. It connects personal choices to national outcomes.
By understanding MPC, you gain a clearer picture of consumer behavior, economic policy, and your own financial tendencies. It’s a simple ratio with powerful implications. Whether you’re analyzing an economy or your own budget, the marginal propensity to consume offers insight that’s both practical and profound.
If you found this guide helpful, take a moment to reflect on your own spending patterns—or explore related concepts like saving behavior and fiscal policy to deepen your understanding.
FAQs
What is the marginal propensity to consume in simple terms
It is the fraction of extra income that a person spends rather than saves.
What is a good marginal propensity to consume value
There is no universal “good” value. It depends on income level, financial security, and economic conditions.
How does marginal propensity to consume affect inflation
High MPC can increase demand, which may push prices up if supply cannot keep pace.
Is marginal propensity to consume the same for everyone
No. It varies by income, age, culture, and economic confidence.
How do governments use marginal propensity to consume
They use it to design policies that maximize economic impact, such as targeted stimulus payments
Michael Grant is a business writer with professional experience in small-business consulting and online entrepreneurship. Over the past decade, he has helped brands improve their digital strategy, customer engagement, and revenue planning. Michael simplifies business concepts and gives readers practical insights they can use immediately.