
Introduction: Why Marginal Propensity to Consume Quietly Shapes Your Life
Have you ever noticed how some people spend almost every extra dollar they earn, while others barely change their lifestyle even after a raise? That simple observation sits at the heart of marginal propensity to consume—one of those economic ideas that sounds academic but shows up everywhere in real life.
From how governments design stimulus checks to how businesses forecast demand, and even how you decide what to do with a bonus, marginal propensity to consume (MPC) quietly drives decisions that affect jobs, prices, and growth. It explains why a $1,000 tax refund can boost the economy in one country but barely move the needle in another. It helps policymakers predict whether people will spend or save during uncertain times. And for individuals, it’s a powerful lens for understanding spending habits—your own and everyone else’s.
In this guide, I’ll break marginal propensity to consume down in plain language, with stories, real-world examples, and practical takeaways. You’ll learn what it is, how it works, why it matters, how to calculate it step by step, and how it’s used by governments, economists, and businesses. By the end, you’ll see MPC not as a textbook formula, but as a practical tool for understanding everyday economic behavior.
Understanding Marginal Propensity to Consume in Simple Terms
Marginal propensity to consume sounds intimidating, but the idea is surprisingly simple. At its core, it answers one question: When income increases, how much of that extra income do people actually spend?
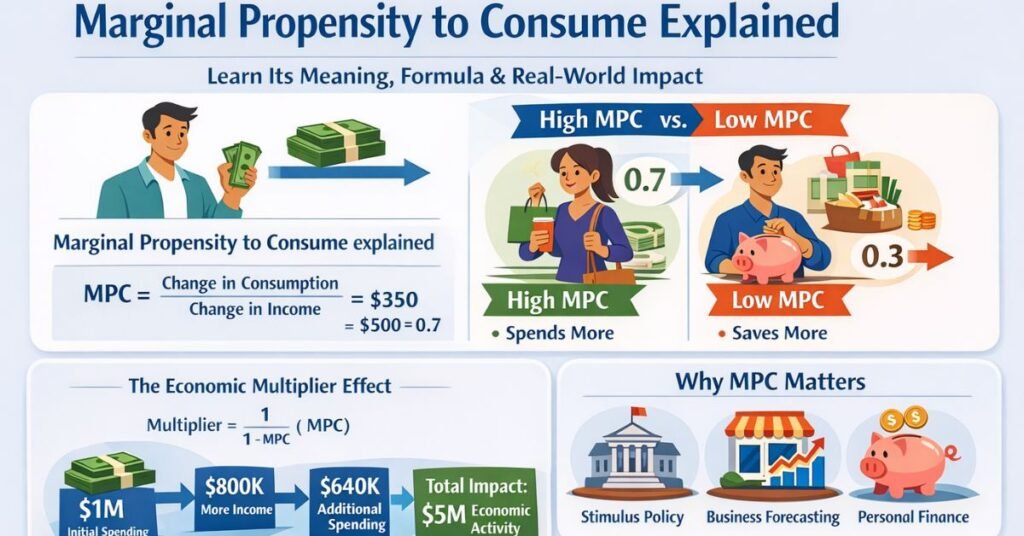
Imagine you get a $100 bonus. If you spend $80 and save $20, your marginal propensity to consume is 0.8. That’s it. MPC is always a number between 0 and 1. A value closer to 1 means people tend to spend most of any new income. A value closer to 0 means they tend to save most of it.
Economists use MPC because total income alone doesn’t tell the whole story. Two people can earn the same raise and respond very differently. One might immediately upgrade their phone, dine out more, or pay overdue bills. Another might quietly put the money into savings or investments. MPC captures that behavioral difference.
A helpful analogy is water flowing into a bucket with a hole at the bottom. Income is the water flowing in. Consumption is the water flowing out. MPC tells you how big that hole is. A large hole means most new water flows right back out as spending. A small hole means the bucket fills up—saving increases.
This is why MPC is central to economic forecasting. When people spend, businesses earn revenue, hire workers, and invest more. When people save instead, growth slows in the short term. Understanding MPC helps explain why some policies stimulate economies quickly while others barely register.
Why Marginal Propensity to Consume Matters in the Real World
Marginal propensity to consume isn’t just an academic curiosity—it actively shapes real-world outcomes. Governments, central banks, and businesses rely on it to predict how money moves through an economy.
For policymakers, MPC determines the effectiveness of fiscal policy. If a government issues stimulus payments during a recession, the goal is to boost spending quickly. That only works if households have a relatively high MPC. Lower-income households, for example, tend to spend a larger share of additional income on essentials. That’s why stimulus programs often target them.
Businesses also depend on MPC, even if they don’t call it that. When a company considers expanding production, launching a new product, or opening new locations, it’s essentially asking: “Will consumers spend more if their incomes rise?” A higher MPC means stronger demand growth.
On a personal level, MPC reveals patterns in financial behavior. People with high MPCs often live paycheck to paycheck—not necessarily because they’re irresponsible, but because their income barely covers necessities. Those with lower MPCs usually have enough buffer to save or invest additional income.
Understanding MPC also clarifies why economic recoveries can feel uneven. If income gains go mostly to groups with low MPCs, spending doesn’t rise much. Growth feels sluggish even when headline income numbers improve. This insight explains many post-crisis recoveries where stock markets soared but consumer spending lagged.
In short, marginal propensity to consume explains who spends, how fast money circulates, and why some economic policies work better than others.
How to Calculate Marginal Propensity to Consume: Step by Step
Calculating marginal propensity to consume is refreshingly straightforward. You don’t need advanced math—just clear data and careful thinking.
The basic formula is:
Marginal Propensity to Consume = Change in Consumption ÷ Change in Income
Let’s walk through it step by step with a realistic example.
Step one is identifying the income change. Suppose a household’s monthly income increases from $3,000 to $3,500. That’s a $500 increase.
Step two is measuring the change in consumption. Before the raise, the household spent $2,700 per month. After the raise, spending rises to $3,050. That’s an increase of $350.
Step three is dividing consumption change by income change.
$350 ÷ $500 = 0.7
That means the marginal propensity to consume is 0.7. For every extra dollar earned, the household spends 70 cents and saves 30 cents.
A few practical tips matter here. First, MPC measures changes, not totals. Total spending doesn’t matter—only how spending changes when income changes. Second, MPC can vary over time. A household might have a high MPC during tough periods and a lower one when finances stabilize.
Economists often calculate MPC using large datasets, averaging across thousands or millions of households. Individuals and businesses can use the same logic on a smaller scale to understand behavior and forecast demand.
Benefits and Use Cases of Marginal Propensity to Consume
Understanding marginal propensity to consume offers concrete benefits across multiple contexts. It’s not just theory—it’s a practical decision-making tool.
For governments, MPC helps design effective economic stimulus. During recessions, policymakers want money to circulate quickly. By targeting groups with higher MPCs—such as lower-income households or those facing liquidity constraints—they maximize the immediate impact of spending programs.
For businesses, MPC informs demand forecasting. If wages rise in a region and consumers there have historically high MPCs, retailers can expect stronger sales. That insight guides inventory planning, staffing, and marketing budgets.
For investors and analysts, MPC sheds light on macro trends. High aggregate MPC often signals strong short-term growth but potentially lower savings rates. Lower MPC can suggest slower growth but more capital available for investment.
For individuals, MPC is a mirror. Tracking how you respond to income changes reveals habits that affect long-term financial health. If every raise disappears into spending, your MPC is high—and savings goals may suffer. If raises mostly go into savings or investments, your MPC is lower, often signaling financial stability.
In all these cases, marginal propensity to consume turns abstract income changes into actionable insights.
Marginal Propensity to Consume and the Multiplier Effect
One of the most powerful concepts tied to marginal propensity to consume is the multiplier effect. This explains why a single dollar of spending can generate more than a dollar of economic activity.
Here’s how it works. Suppose the MPC in an economy is 0.8. When the government injects $1 million into the economy, people spend $800,000 of it. That $800,000 becomes income for others, who then spend 80% again—$640,000. This cycle repeats, each round smaller than the last.
The multiplier formula is:
Multiplier = 1 ÷ (1 − MPC)
With an MPC of 0.8, the multiplier is 5. That means the initial $1 million can ultimately generate up to $5 million in total economic activity.
This is why MPC is so critical in policy debates. A small difference in MPC can dramatically change outcomes. An economy with an MPC of 0.6 has a multiplier of 2.5. With 0.9, the multiplier jumps to 10.
Understanding this helps explain why some stimulus programs feel powerful while others fizzle. It’s not just the size of the spending—it’s how people respond to receiving that money.
Tools, Data Sources, and Practical Ways to Estimate MPC
Estimating marginal propensity to consume doesn’t always require massive datasets. Depending on your role, different tools can help.
Economists rely on household surveys, national income accounts, and consumption data. Government statistical agencies publish detailed reports on income and spending patterns, which researchers use to estimate MPC across income groups.
Businesses often use internal sales data combined with local income trends. If customer spending rises consistently when incomes rise, that suggests a higher MPC among their customer base.
Individuals can estimate their own MPC using simple budgeting tools. Track income changes over time and note how spending adjusts. Spreadsheet software or budgeting apps make this easy.
Free tools include basic spreadsheet templates and publicly available economic datasets. Paid tools—such as advanced analytics platforms—offer deeper insights, predictive modeling, and scenario analysis.
The key is consistency. MPC isn’t about perfect precision. It’s about understanding behavioral patterns well enough to make better decisions.
Common Mistakes When Using Marginal Propensity to Consume
Despite its simplicity, marginal propensity to consume is often misunderstood. One common mistake is confusing MPC with average propensity to consume. Average measures total spending divided by total income, while MPC focuses strictly on changes. Mixing them leads to incorrect conclusions.
Another mistake is assuming MPC is constant. In reality, it varies by income level, economic conditions, and even psychological factors. People tend to have higher MPCs during crises and lower MPCs when uncertainty rises.
Some analysts also overlook distribution effects. An economy-wide average MPC hides important differences. High-income households typically have lower MPCs than low-income ones. Ignoring this can weaken policy or business strategies.
Finally, many people forget that MPC is short-term focused. Saving today doesn’t mean money disappears—it can fuel investment later. MPC helps explain timing, not long-term value judgments.
Real-World Examples That Make MPC Click
To make marginal propensity to consume tangible, consider stimulus checks during economic downturns. Studies consistently show that households under financial stress spend a large portion of these payments quickly. Their MPC is high because needs are immediate.
Contrast that with tax cuts for high-income earners. Much of that income may be saved or invested, resulting in a lower MPC and a weaker short-term boost to consumption.
On a personal level, think about your first job raise. Many people celebrate with new purchases, reflecting a high MPC early in their careers. Over time, as incomes rise and needs stabilize, MPC often declines.
These examples highlight why MPC is less about morality and more about circumstances.
Conclusion: Why Marginal Propensity to Consume Deserves Your Attention
Marginal propensity to consume is one of those rare economic ideas that’s both simple and powerful. It explains how income turns into spending, why some policies succeed while others disappoint, and how individual behavior scales into national outcomes.
Whether you’re a policymaker designing stimulus, a business forecasting demand, or an individual trying to understand spending habits, MPC offers clarity. It reminds us that money doesn’t drive growth by existing—it drives growth by moving.
Once you start seeing the world through this lens, economic headlines make more sense. And everyday financial decisions feel more intentional. If this guide helped clarify MPC for you, explore how it applies to your own income changes—or share your thoughts and questions below.
FAQs
What is marginal propensity to consume in simple words?
It’s the fraction of extra income that people spend rather than save.
Is marginal propensity to consume always between 0 and 1?
Yes. A value of 0 means all extra income is saved, while 1 means all of it is spent.
How does income level affect marginal propensity to consume?
Lower-income households usually have higher MPCs because they spend more of any additional income on necessities.
Why is MPC important for government policy?
It helps predict how effective stimulus or tax changes will be at boosting spending and growth.
What’s the difference between MPC and saving rate?
MPC focuses on spending from extra income, while saving rate measures how much income is saved overall.
Michael Grant is a business writer with professional experience in small-business consulting and online entrepreneurship. Over the past decade, he has helped brands improve their digital strategy, customer engagement, and revenue planning. Michael simplifies business concepts and gives readers practical insights they can use immediately.